The realm of data science encompasses a broad spectrum of skills and methods designed to extract valuable insights from data. This interdisciplinary field can be leveraged across many domains, encompassing business, healthcare, education, social media, and beyond. Yet, becoming a data scientist is no small feat, necessitating arduous learning, practice, and experience. In this blog post, I aim to offer a data science roadmap to guide you through your journey toward becoming a proficient data scientist.
I. Data collection
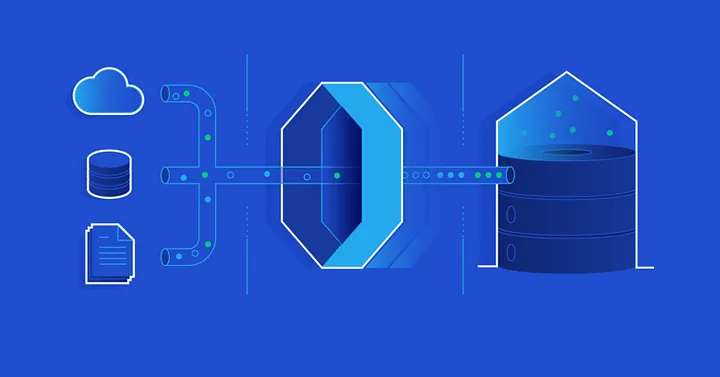
Data collection is the first stage of the data science roadmap. It involves finding, acquiring, and storing data from various sources, such as databases, APIs, web scraping, surveys, etc. Data collection also consists of cleaning and preprocessing the data to prepare it for analysis and modeling.
- SQL: SQL is a language for querying and manipulating data from relational databases. SQL is essential for data scientists who work with structured data.
- Python: Python is a general-purpose programming language that has many libraries and frameworks for data science, such as pandas, Numpy, etc. Python is widely used for data collection, analysis, modeling, and communication.
- R: R is another programming language that is popular among data scientists who work with statistical analysis and visualization. R has many packages and tools for data science, such as tidyverse, R shiny, etc.
- Web scraping: Web scraping is a technique for extracting data from websites using tools like BeautifulSoup, Selenium, Scrapy, etc. Web scraping can be useful for collecting unstructured or semi-structured data from the web.
- APIs: APIs are interfaces that allow you to access data from various platforms and services, such as Twitter, Google Maps, Spotify, etc. APIs can be useful for collecting real-time or dynamic data from the web.
II. Data analysis
Data analysis is the second stage of the data science roadmap. It involves exploring, summarizing, and visualizing the data to understand its characteristics, patterns, trends, and relationships. Data analysis also involves applying statistical methods and tests to validate hypotheses and draw conclusions from the data.
- Exploratory data analysis (EDA): EDA is a process of exploring the data using descriptive statistics and visualizations to gain insights and intuition about the data. EDA can help you identify outliers, missing values, distributions, correlations, etc. Check out this https://medium.com/@david-analytics/eda-with-pandas-profiling-7a0f37b75f95 on EDAs
- Data visualization: Data visualization is the representation of data in graphical or pictorial forms, such as charts, graphs, and maps. It is a powerful tool for effectively and intuitively communicating insights and findings.
- Statistical analysis: Statistical analysis involves applying mathematical and statistical methods to data to draw meaningful conclusions. It can be used to test hypotheses, compare groups (Anova), identify relationships (Regression and Correlation), Time series, and more.
- Python: Python has many libraries and frameworks for data analysis and visualization, such as Pandas, Numpy, matplotlib, seaborn, plotly, etc.
- R: R has many packages and tools for data analysis and visualization, such as tidyverse, ggplot2, R shiny, etc.
III. Data modeling
Data modeling is the third stage of the data science roadmap. It involves building and evaluating machine learning models that can learn from the data and make predictions or recommendations based on the data. Data modeling also involves optimizing and tuning the models to improve their performance and accuracy.
- Machine learning: Machine learning is a branch of artificial intelligence that uses algorithms and techniques to learn from the data and make predictions or recommendations based on the data. Machine learning can be divided into three types: supervised learning (e.g., regression, classification), unsupervised learning (e.g., clustering, dimensionality reduction), and reinforcement learning (e.g., Q-learning, deep Q-network).
- Deep learning: Deep learning is a subset of machine learning that uses neural networks to learn from complex and high-dimensional data. Deep learning can be applied to various domains, such as computer vision (e.g., image recognition, face detection), natural language processing (e.g., text generation, sentiment analysis), and speech recognition (e.g., speech-to-text, text-to-speech).
- Python: Python has many libraries and frameworks for machine learning and deep learning, such as scikit-learn, tensorflow, keras, pytorch, etc.
- R: R has some packages and tools for machine learning and deep learning, such as caret, mlr, h2o, Keras, etc.
IV. Data communication
Data communication is the fourth and final stage of the data science roadmap. It involves presenting and communicating the results and insights from the data analysis and modeling to various stakeholders, such as clients, managers, peers, etc. Data communication also involves creating reports, dashboards, and stories that can convey the value and impact of the data science project.
- Storytelling: Storytelling is a technique for creating a narrative that can engage and persuade the audience with the data. Storytelling can help you explain the problem, solution, and outcome of the data science project clearly and compellingly.
- Presentation: Presentation is a technique for delivering the data story to the audience using slides, videos, audio, etc. The presentation can help you showcase your skills and expertise as a data scientist and demonstrate the value and impact of your work.
- Report: A report is a technique for documenting the data story in a written format, such as PDF, Word, etc. A report can help you provide details and evidence for your findings and recommendations.
- Dashboard: A dashboard is a technique for creating interactive and dynamic visualizations that can display the data story in a graphical format, such as charts, graphs, maps, etc. The dashboard can help you monitor and track the performance and progress of the data science project.
- Python: Python has some libraries and frameworks for data communication, such as Jupiter Notebook, streamlit, dash, etc.
- R: R has some packages and tools for data communication, such as markdown, knitr, shiny, etc.
“You can only stop yourself from achieving greatness if you let your doubts and fears overpower your faith and courage”
in conclusion, this blog post offers a comprehensive roadmap for aspiring data scientists, outlining the four main stages of data collection, analysis, modeling, and communication. Within each stage, there are sub-stages and specific tools to master. I hope this guide serves as a helpful resource for your data science journey in 2024, providing both guidance and inspiration. Keep in mind that the path to becoming a data scientist is not fixed or linear, but rather an iterative and flexible process that depends on your unique goals, interests, and background. So don’t hesitate to tailor this roadmap to your individual needs and preferences. Remember do not gree for (Allow) laziness this year. Best of luck on your learning journey!


No comments:
Post a Comment